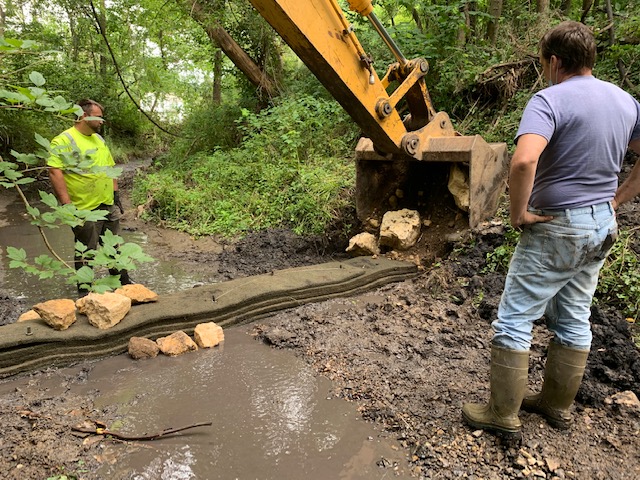
In 2019, PSCW started developing plans with the City of Davenport to install a series of biofilters and conduct a pilot study for reduction of fecal pollution in the Duck Creek Watershed.
Three filters were installed along a stretch of Robin Creek in 2020 and monitored for water quality parameters and E. coli for two years. A full report of the study is below.
Background
Fecal pollution is a common water quality issue in many waterways of the United States. While there are many likely sources, and many bacteria and viruses included under the fecal pollution umbrella, the most common way to determine the presence of such pollution is through an indicator species. Escherichia coli (E. coli) is an indicator species commonly used to determine the presence of fecal pollutions, and had been utilized in Iowa streams and lakes for over 20 years.
Historic E. coli sampling in the rural and urban portions of Scott County has indicated fecal pollution issues are present. In 2011, a Total Maximum Daily Load (TMDL) was developed for Duck Creek, a stream whose watershed is roughly half urban and half rural in land use. The TMDL has an E. coli single sample target of 235 colony forming units per 100 milliliters (CFU/100 mL) and a geometric mean (5 samples in 30 days) of 126 CFU/100 mL. These standards apply only during the recreation season (March 15 to November 15).
Partners of Scott County Watersheds (PSCW) in conjunction with the City of Davenport has strived to determine how to reduce E. coli and hence fecal pollutions concentrations within the Duck Creek Watershed and other streams.
As such, during research on methods of E. coli remediation, a pilot project was discovered occurring in Franklin County, Ohio by the Franklin County Soil and Water Conservation District (Franklin County SWCD). Kurt Keljo, a watershed coordinator for the Franklin County SWCD, and his colleagues, were experimenting with placing strips of floating island materials and building ”biofilters” within small streams. The initial purpose of the biofilters was to enhance aquatic habitat by allowing water to pass through the materials while also trapping fine sediments. The materials, which are patented by different companies, are a recycled-plastic fiber mat, which has the consistently similar to steel wool. The materials form a dense, permeable matrix in which there are many interconnected pathways, allowing for a large internal surface area.
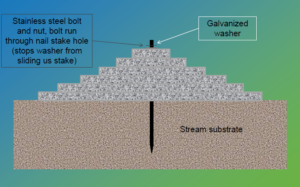
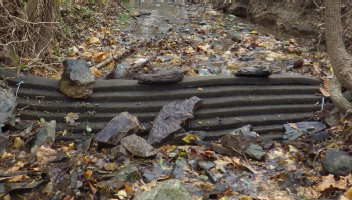
While conducting various pilot studies with the materials, the Franklin County SWCD conducted upstream and downstream sampling and analyses on nutrients, dissolved oxygen, pH and E. coli concentrations. They were able to observe detectable reductions in E. coli, but was unable to quantify the reductions further and due to funding limitations, were unable to pursue further study. After discovering the project through internet research, PSCW conducted numerous conversations with the Franklin County SWCD to learn the background of the project and get diagrams and tips on installation of such biofilters in the Scott County area. Below is a diagram of the internal construction of a biofilter and a photo of a biofilter installed by the Franklin County SWCD.
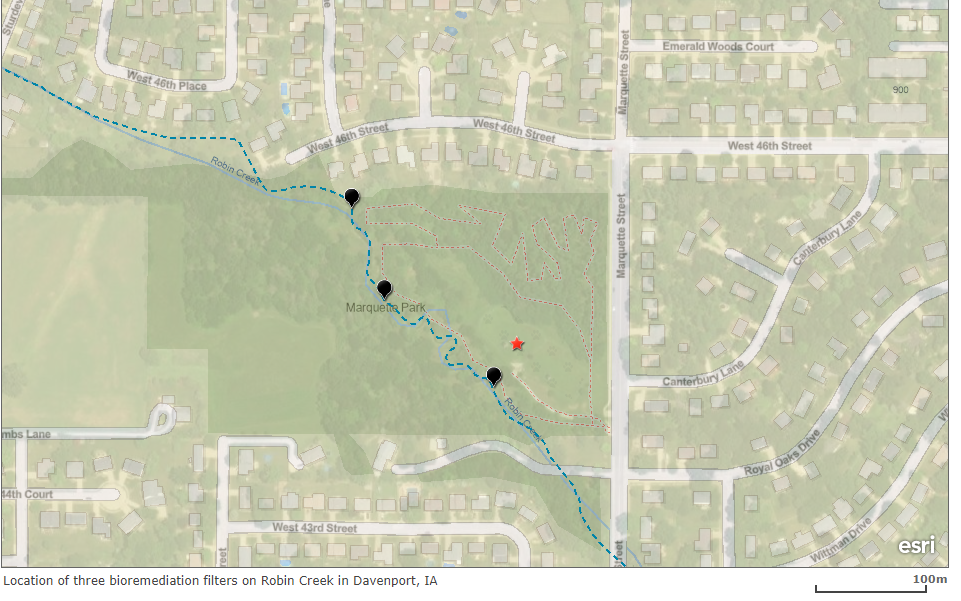
In 2019, PSCW started developing plans with the City of Davenport to install a series of biofilters and conduct a pilot study for reduction of fecal pollution. Robin Creek, located in west-central Davenport, was selected as the location for the biofilter installation. A section of Robin Creek located adjacent to a dog park and on city property had recently been restored to reduce bank erosion and remove invasive species on the flood plain. This section was chosen as the location for the pilot study.
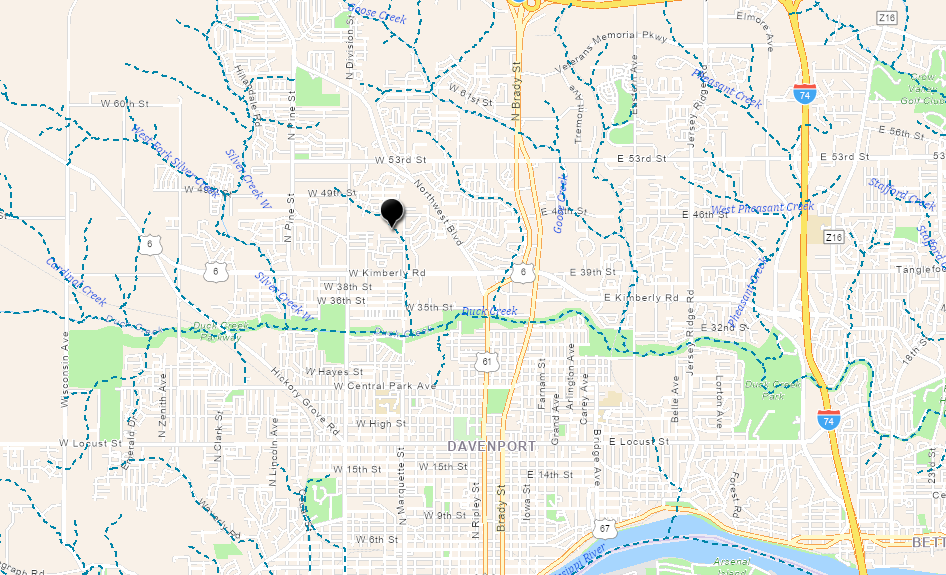
Where is this?
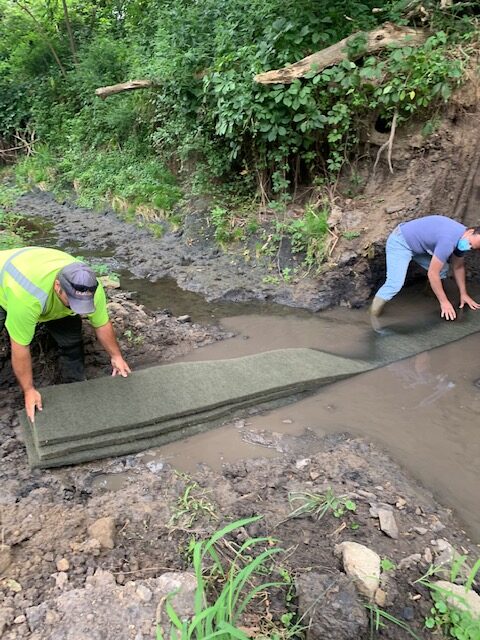
Each biofilter consisted of 4 to 6 separate layers of the matrix fabric, roughly 2 inches thick, and ranging from 12 to 24 inches wide. A shallow trench was excavated in the stream bed at the location desired, as well as into the adjacent stream bank. The layers of matrix fabric were laid down one on top of each other to the desired height of the stream bed.
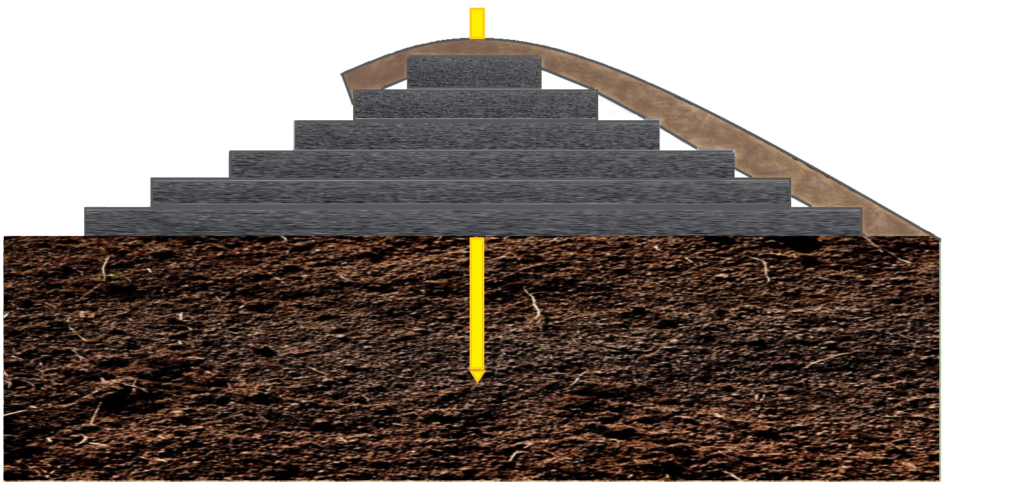
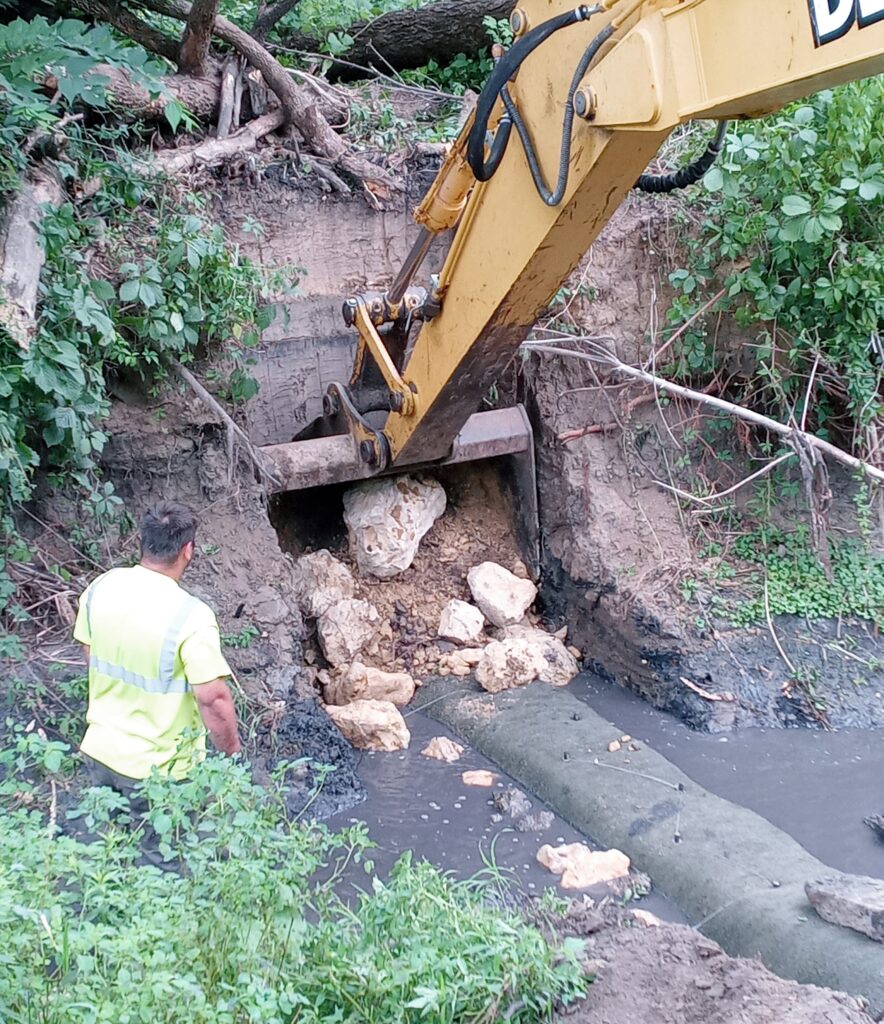
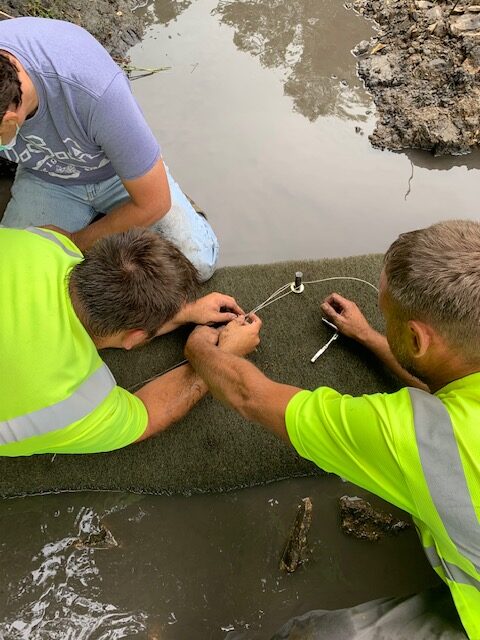
Once the desired height and thickness of the biofilter was attained, metal rebar spikes were driven from the top of the biofilter vertically into the stream bed. At the same time, cabling was installed through the spikes and around the filters to add stability and resist against flow. Once in place, various size rocks ranging from 10 to 50 pounds were installed upstream, downstream, and within the bank trenches to help stabilize the biofilter, resist against high flows, prevent erosion, and help direct normal flow. Once installation was complete, soil was placed back on the bank and bank seeding was initiated. The biofilter design and materials allow water to flow through, however water does occasionally back up upstream of the biofilter and eventually overtop, depending on flow conditions.
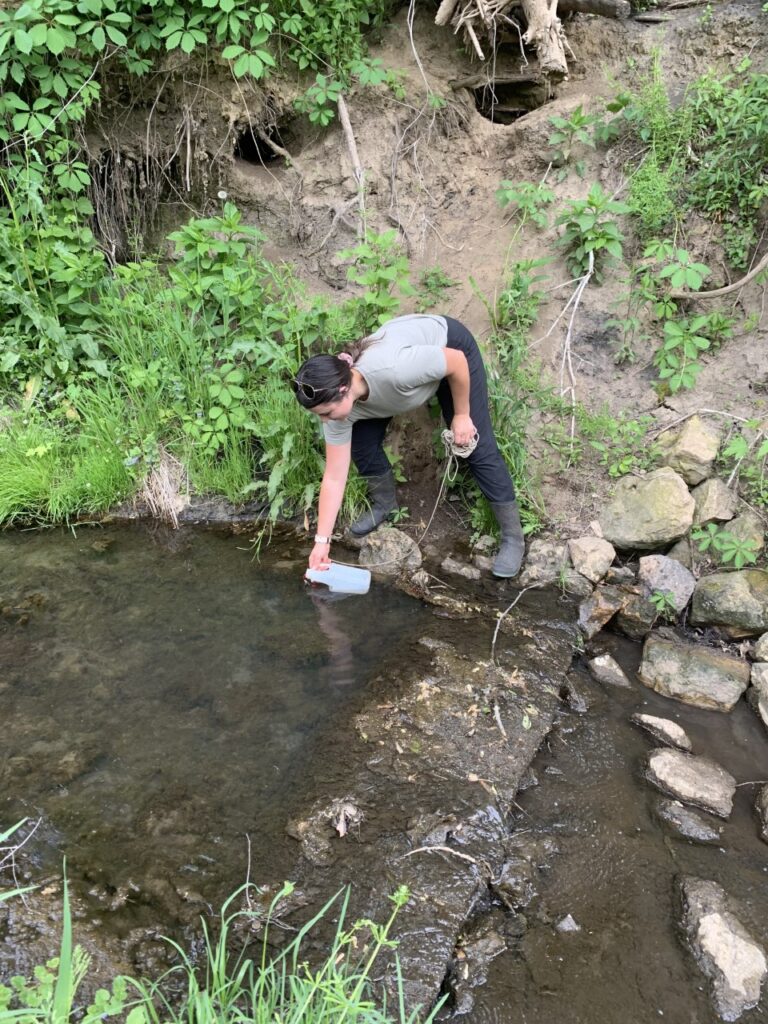
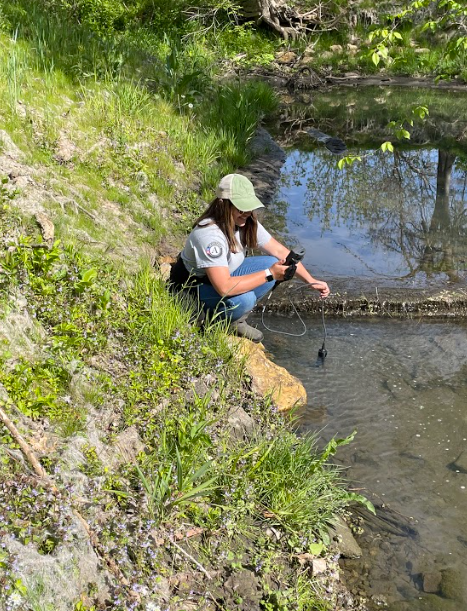
A grant was applied for and awarded by Iowa American Water Company in 2020 to assist with the cost of materials and installation of three biofilters. The remainder of the cost for materials was provided by the City of Davenport. Budget allowed for the installation of three biofilter locations; these were installed in sections of Robin Creek within city property and within runs outside of meandering sections of the channel. The City of Davenport and PSCW developed a design that met the criteria for flood plain permitting and also utilized the materials on hand. Each biofilter consisted of 4 to 6 separate layers of the matrix fabric, roughly 2 inches thick, and ranging from 12 to 24 inches wide. A shallow trench was excavated in the stream bed at the location desired, as well as into the adjacent stream bank. The layers of matrix fabric were laid down one on top of each other to the desired height of the stream bed. A monitoring program began the month after installation, starting in September of 2020. PSCW, the City of Davenport, and St. Ambrose University (SAU) partnered to collect and analyze data for this pilot study. Staff from all three organization participated in the monthly site visits. Monthly sample collection was conducted in the fall of 2020, May through November of 2021, and May through November of 2022. Field kit parameters measured during the evaluation period included transparency, water temperature, nitrite, nitrate, chloride, total dissolved solids and dissolved oxygen. Initially, a YSI multiparameter meter probe was utilized to measure specific conductance, oxidation-reduction potential, conductivity, dissolved oxygen, and pH. Observations on filter condition, sediment accumulation, and overall location conditions were taken. A hand-held probe was used to measure total dissolved solids, salinity, and pH. For E. coli, samples were analyzed by SAU or by a local laboratory, Quad City Analytical Services. For the SAU analyses, total coliform was determined as well. Initially, samples were collected immediately upstream and downstream of each biofilter, but as resources dwindled and SAU had to leave the project, sample collection was reduced to one sample upstream of Biofilter 1 (most upstream location) and one sample downstream of Biofilter 3 (most downstream location).
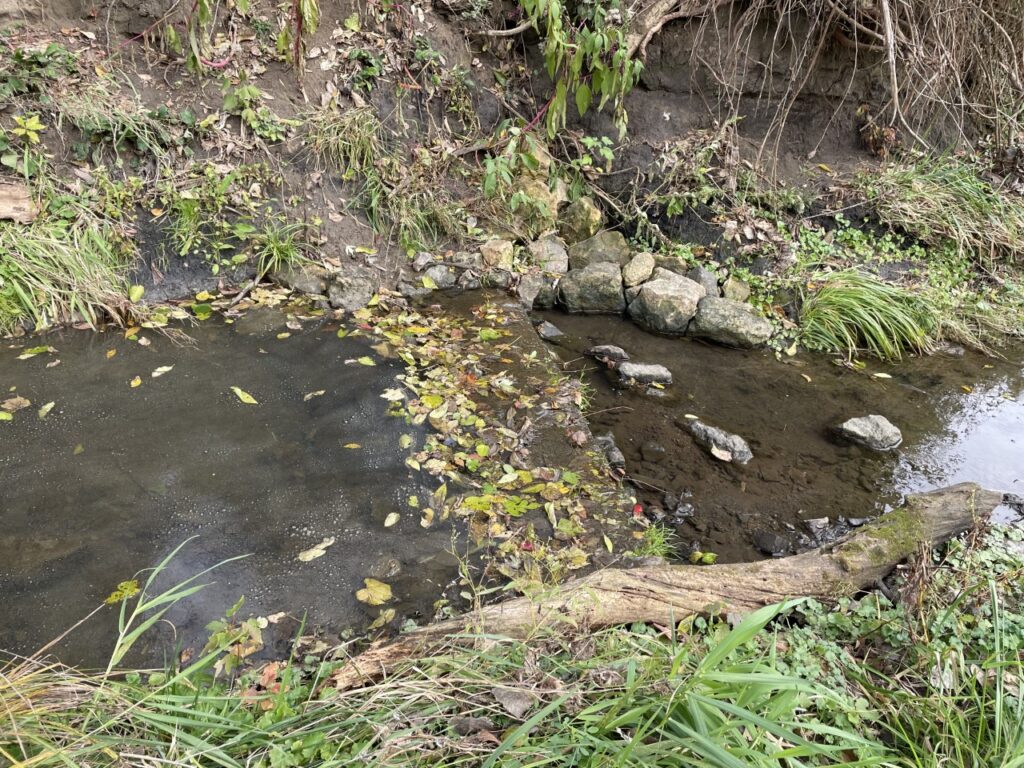
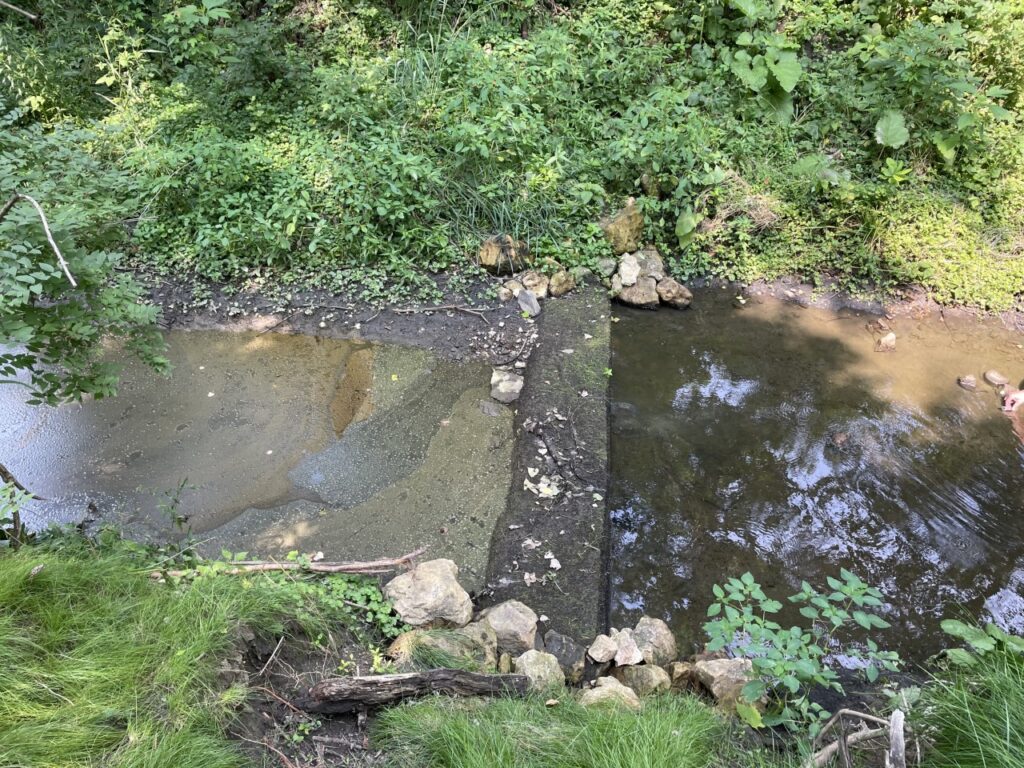
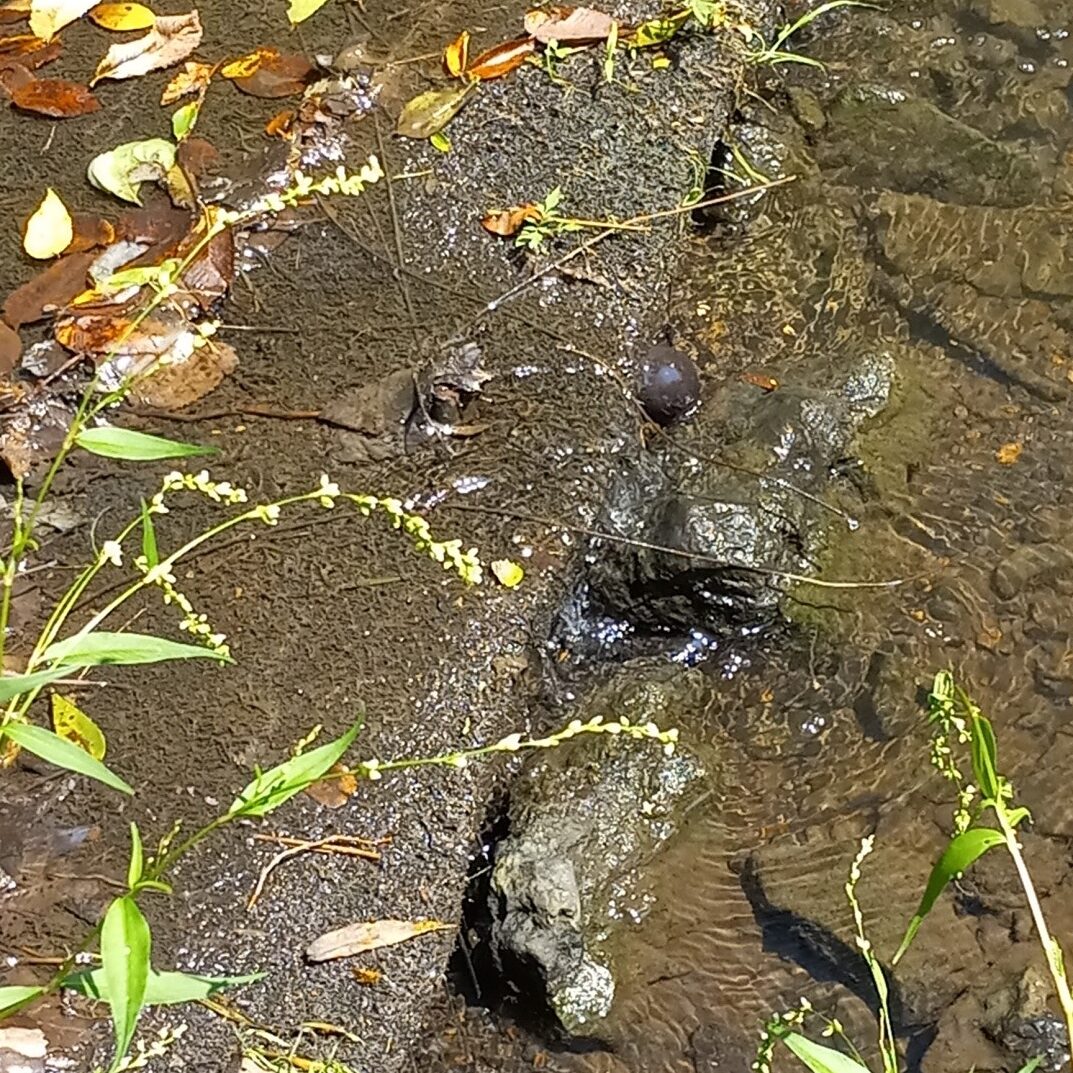
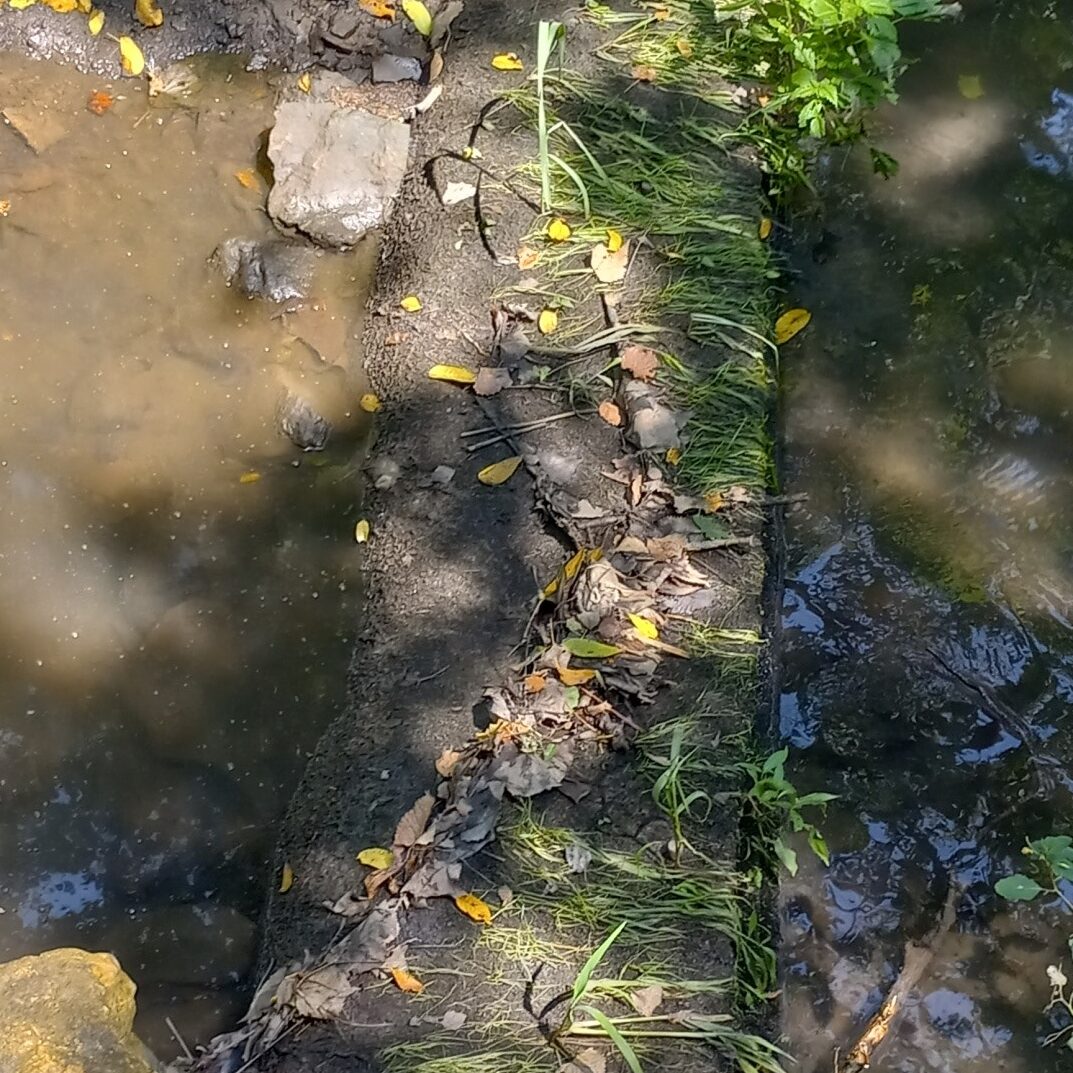
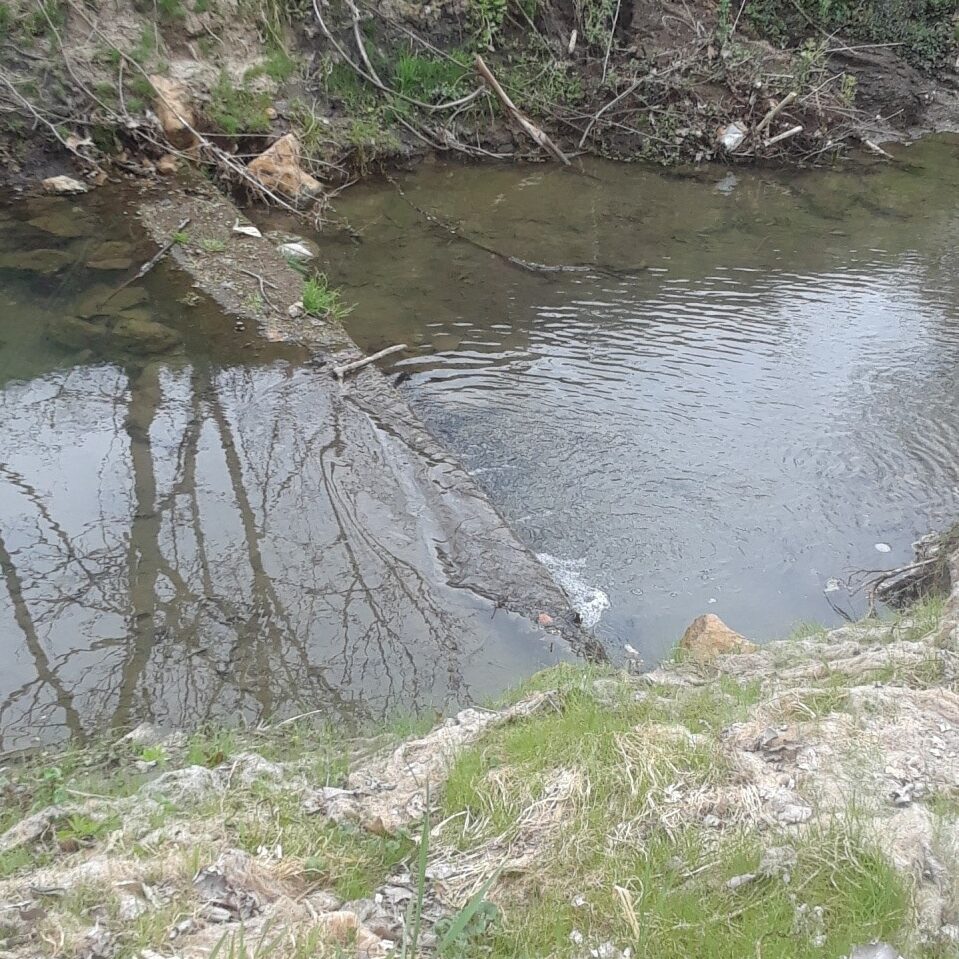
Below are images of each filter approximately one year after installation:
Observations
For parameters measured with the hand-held or YSI multiparameter meter, results appeared fairly stable from upstream to downstream locations. Parameters were within normal ranges for a small stream.
For the field kit parameters, only transparency and dissolved oxygen indicated significant variation from upstream and downstream samples. Nitrate, nitrite and ammonia were non-detect or very low, as was orthophosphate. Water temperature remained consistent with normal expected seasonal conditions and did not vary upstream to downstream. Chloride was detected as various times but indicated no variation upstream to downstream. Transparency ranged significantly seasonally and at time decreased from upstream to downstream. Dissolved oxygen remained typical within normal ranges for a small stream, and some increases were observed upstream to downstream. Decreases from upstream to downstream for dissolved oxygen were observed during some summer months.
Fifteen total coliform samples were collected for analysis, of which ten were able to provide useful data. This was due to laboratory error or maximum detection limitations. Upstream samples ranged from 759 to 155310 CFU/100 ml. Downstream samples ranged from 748 to 241960 CFU/100 ml. Six of the ten samples indicated a decrease in total coliform. The largest percentage decrease was 92.3%, while the least was 1.4%. The largest increase in concentrations upstream to downstream was 55.8%, occurring in August 2021. Overall, the mean percentage reduction upstream to downstream over the evaluation period was 6.7%. Fifteen E. coli samples were collected for analysis, of which all were able to provide useful data. Upstream sample results ranged from 57 to 17890 CFU/100 ml. Downstream samples ranged from 3 to 48840 CFU/100 ml. Twelve of the fifteen samples indicated a decrease in E. coli concentration, two showed increases, and one sample indicated no change. The largest percentage decrease was 94.9%, the least was 4.6%. The largest increase in concentrations upstream to downstream was 173%, occurring in June 2021. In August 2021 a decrease of 43.1% was observed. Overall, the mean percentage reduction upstream to downstream over the evaluation period was 27.3%.
Some sediment accumulation was observed immediately upstream of Biofilters 2 and 3. During the course of the evaluation period, some of the riprap had moved and required repositioning as to prevent direction of flows towards streambanks. Other than these instances, the biofilters remained stable and did not appear to suffer any damage. Moderate growth of vegetation on Biofilter 3 was observed in the form of small non woody plants.
Discussion
Over the course of the evaluation period, various seasonal climate and flow conditions were observed. As such, it can reasonably be expected that typical conditions encountered for Robin Creek occurred during the evaluation period. Robin Creek is an urban stream, and has all the common influences of such a stream, such as stormwater runoff, flashy flows during storm events, urban refuse accumulation, and human interaction.
In general, no significant variations on most water quality parameters were observed between the incoming stream flow entering the biofilter assemblage and the flow leaving the assemblage downstream. Variations in transparency were largely influenced by the presence of floating algae or other detritus during warm temperatures and low flow conditions. The nature of the biofilters allows them to behave like small check dams, so during low flow conditions water may not flow over the biofilters, but only through, so floating materials tend to back up behind the biofilter and reduce overall transparency. This appears to be the case with dissolved oxygen variations to an extent, although some increases from upstream to downstream are likely due to the water flowing over the biofilter, actively mixing atmospheric oxygen into the water column.
Based on the measured total coliform and E. coli data, there appears to be some influence on fecal bacteria by the biofilter assemblage. More specifically, it appears reductions in E. coli occurred from upstream raw input water concentrations to the downstream location, where the input water had encountered three biofilters. When samples could be collected between biofilters, variation was observed, but either a trend of increasing or decreasing was observed, consistent with the overall upstream to downstream trend observed during a particular sample event. Increases were also observed, sometimes quite significant, and may be related to low flow conditions.
Conclusions
The biofilter assemblage appeared to have no direct influence on typical water quality parameters over the evaluation period. Decreases in total coliform and E coli were observed, with decreases in E. coli were more pronounced and consistent. While historical E. coli analysis throughout Scott County are highly variable, it is unlikely that 67 percent of E. coli samples would naturally show a decrease in concentrations from upstream to downstream, as was observed in the biofilter assemblage area.
Considering the reductions observed by the Franklin County SWCD in their project and the reduction observed using the Davenport/PSCW pilot study, it appears the Robin Creek biofilter assemblage reduced fecal bacteria concentrations to a degree, roughly 25%. Further analysis is warranted, however. A control stream with similar conditions and sampling regime would be beneficial, as well as fecal DNA analysis concurrent with E. coli sampling. This control and testing would help identify any influences that are not seen that could be causing E. coli reductions. In addition, further analysis of the bacteria community present within the biofilter matrix would help with understanding of how and what is causing the observed reductions.
